Trend Analysis with Moving Averages Simplified
# Trend Analysis Using Moving Averages
Trend analysis, a cornerstone of market analysis in various fields such as stocks, commodities, and even research, leverages mathematical tools to predict future movements based on historical data. Among these tools, moving averages (MAs) stand out for their simplicity and effectiveness. This article explores how moving averages can be used to analyze trends, highlighting their practical applications and guiding you through the steps to perform your own analysis.
##
Introduction to Moving Averages
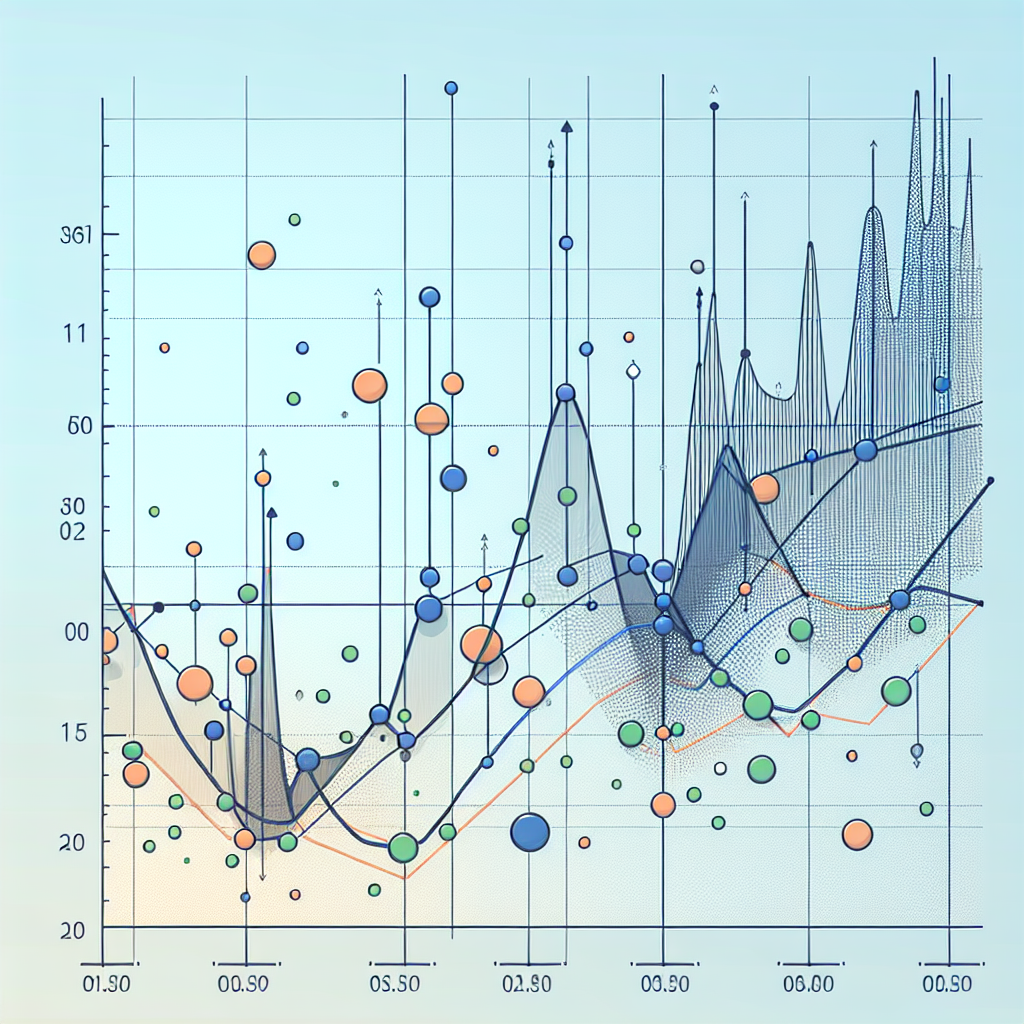
Moving averages smooth out price data to create a single flowing line, making it easier to identify the direction of the trend. By comparing different MA periods, analysts can glean insights into potential future movements of market prices or research data points.
##
Types of Moving Averages
There are several types of moving averages, each with its unique calculations and applications.
###
Simple Moving Average (SMA)
The Simple Moving Average is the simplest form of MA, calculated by adding the prices over a specific period and then dividing by the number of periods. It provides a smooth line that tracks the trend over the chosen time frame.
###
Exponential Moving Average (EMA)
The Exponential Moving Average gives more weight to recent prices, making it more responsive to new information. This is particularly useful for traders looking to react quickly to recent market movements.
###
Weighted Moving Average (WMA)
The Weighted Moving Average also emphasizes more recent prices but does so in a linear fashion. It’s a middle ground between the SMA and EMA, offering a balance of sensitivity and smoothness.
##
How to Use Moving Averages for Trend Analysis
Analyzing trends using moving averages involves several steps, from selecting the right type of MA to interpreting the data effectively. Here’s a step-by-step guide to get you started.
###
Step 1: Choose Your Data Set
The first step is to select the data set you want to analyze. This could be daily stock prices, monthly sales numbers, or any other relevant data.
###
Step 2: Select the Type of Moving Average
Decide whether an SMA, EMA, or WMA best suits your analysis goals. If you’re new to using moving averages, it may be useful to experiment with each type to see which provides the most meaningful insights for your specific data.
###
Step 3: Determine the Period
The period of the moving average will significantly influence the results of your analysis. A shorter period MA will be more sensitive to price changes, while a longer period MA will provide a smoother trend line.
###
Step 4: Calculate the Moving Average
Using your chosen period and type of MA, calculate the moving average for your data set. This can be done manually, through a spreadsheet, or with specialized software.
###
Step 5: Analyze the Trends
Once you have your moving average, you can start analyzing the trends. Look for crossovers between short-term and long-term MAs as potential indicators of trend changes. Uptrends can be identified when the MA line moves upwards, while downtrends are seen when it moves downwards.
###
Step 6: Confirmation and Other Indicators
It’s important to use other indicators and analysis techniques to confirm the trends identified by moving averages. No tool should be used in isolation, as combining multiple methods can provide a more accurate picture of market movements.
##
Conclusion
Moving averages are a powerful tool for trend analysis, offering a straightforward way to smooth out data and identify directional movements in markets or research data. By understanding the different types of MAs and following a systematic approach to analyzing trends, you can uncover valuable insights that might be hidden within the raw data. Whether you’re a professional analyst, a trader, or a researcher, mastering the use of moving averages can significantly enhance your analytical capabilities.