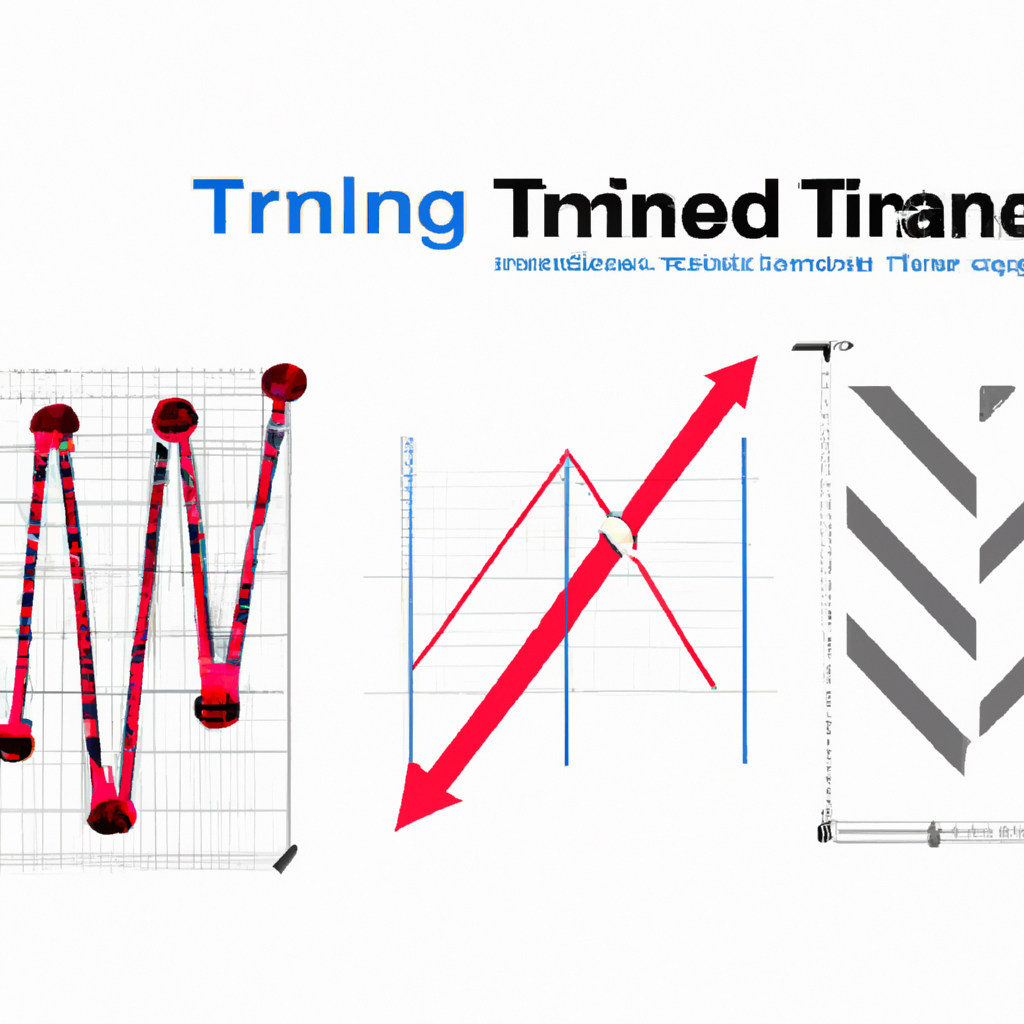
Identifying Trend Lines: Techniques for Analyzing Market Trends
Trend Line Identification Techniques
Introduction
Trend lines are an essential tool used in technical analysis to identify the direction of a market trend. By drawing trend lines on a price chart, traders can visually see the overall trend and make informed decisions about when to enter or exit a trade.
Types of Trend Lines
There are three main types of trend lines that traders use:
1. Upward Trend Line
An upward trend line is drawn by connecting the lows of a price chart. It indicates a bullish trend where prices are moving higher over time.
2. Downward Trend Line
A downward trend line is drawn by connecting the highs of a price chart. It indicates a bearish trend where prices are moving lower over time.
3. Sideways Trend Line
A sideways trend line is drawn horizontally to connect the highs and lows of a price chart. It indicates a range-bound market where prices are moving sideways with no clear trend.
How to Identify Trend Lines
1. Identify Swing Highs and Lows
To draw a trend line, you need to identify swing highs and swing lows on a price chart. A swing high is a peak in price that is higher than the prices before and after it, while a swing low is a trough in price that is lower than the prices before and after it.
2. Draw the Trend Line
For an upward trend line, connect at least two swing lows to form a straight line that slopes upwards. For a downward trend line, connect at least two swing highs to form a straight line that slopes downwards. For a sideways trend line, connect both swing highs and swing lows to form a horizontal line.
3. Confirm the Trend Line
Once you have drawn the trend line, confirm it by looking for at least three points of contact with price. The more points of contact, the stronger the trend line.
Conclusion
By using trend lines, traders can identify market trends and make more informed trading decisions. Understanding how to draw and confirm trend lines is essential for successful technical analysis.