Guide to Finding Reliable Support Levels in Trading
# Finding Reliable Support Levels
In the realm of investing, especially within the stock and cryptocurrency markets, identifying reliable support levels can be a pivotal strategy for both novice and seasoned traders. Understanding and locating these levels not only help in making informed buying decisions but also in setting up effective risk management techniques. This article serves to shed light on methods to find reliable support levels, offering a step-by-step guide suited for anyone looking to enhance their trading strategies.
##
Understanding Support Levels
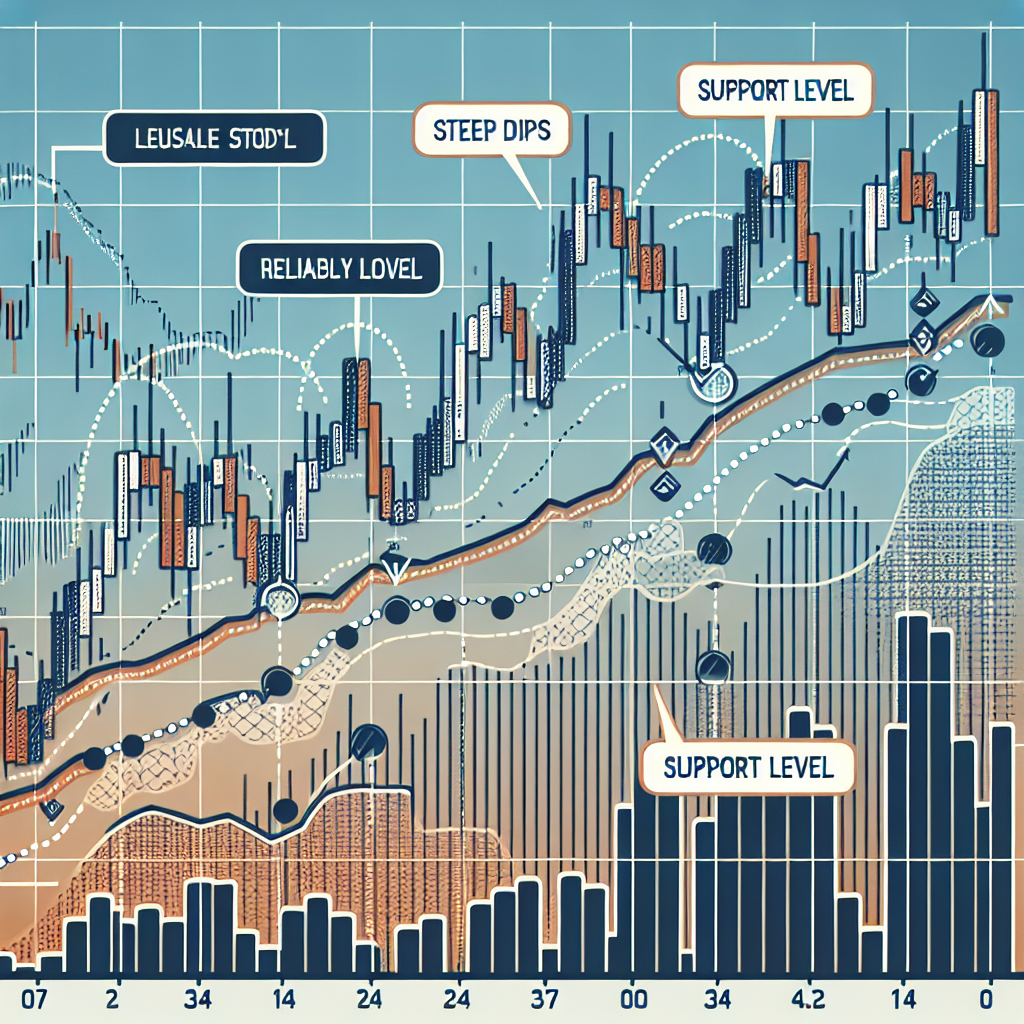
Before diving into the methodology of finding support levels, it’s crucial to grasp what they represent. A support level is a price point on a chart at which a downward trend is expected to pause due to a concentration of demand. As the price of a security, such as a stock or cryptocurrency, drops, demand for the asset increases, thus forming a “support” line. At this juncture, it is typically believed that buyers will outnumber sellers, preventing the price from falling further and potentially leading to a price increase.
##
Method 1: Using Historical Data
###
Step 1: Analyze Past Performance
Begin by examining the historical performance of the security you’re interested in. Look for patterns where the price has stopped falling and has either plateaued or reversed. These are your potential support levels. It’s essential to note multiple occurrences, as the more times the price touches a level and reverses, the stronger the support.
###
Step 2: Draw Support Lines
Using a charting tool, draw horizontal lines at these price points. These lines represent visual depictions of support levels. They serve as a guide to understanding at what levels the security might potentially hold strong against further declines.
##
Method 2: Incorporating Technical Indicators
###
Utilizing Moving Averages
Moving averages are instrumental in smoothing out price data over a specified period and can be a powerful tool in identifying support levels. A commonly used moving average is the 200-day moving average, where the price level of the moving average can act as a support level. When the price of the security drops but stays above the moving average, it’s seen as being at a robust support level.
###
Applying Fibonacci Retracement Levels
Fibonacci retracement is a tool used to identify potential support (or resistance) levels based on the Fibonacci sequence. After determining a high and low point on a chart, applying the Fibonacci retracement tool will display percentage levels. These percentages often coincide with significant support levels, particularly the 61.8%, 50%, and 38.2% retracement levels.
##
Method 3: Observing Volume Patterns
Volume plays a crucial role in confirming support levels. An authentic support level is often accompanied by an increase in trading volume. This surge signifies that a large number of traders are buying at this level, providing further evidence of strong demand. When identifying support levels using historical data or technical indicators, corroborate these findings with volume patterns for additional validation.
##
Final Thoughts
Finding reliable support levels requires patience, practice, and a keen eye for detail. While the methodologies outlined above offer a structured approach to identifying these levels, remember that market conditions can change abruptly. Support levels, though indicative of past performance, do not guarantee future outcomes. Incorporating these strategies within a well-rounded risk management plan, and continuous learning will significantly enhance your trading acumen. Always be prepared for the unexpected, and use support levels as a guide, not an absolute.