Using Moving Averages for Effective Trend Analysis
Using Moving Averages for Trend Analysis
Introduction
When it comes to analyzing trends in financial markets or any other data set, moving averages can be a valuable tool. Moving averages help smooth out fluctuations in data and provide a clearer picture of the underlying trend. In this article, we will explore how to use moving averages for trend analysis.
What is a Moving Average?
A moving average is a calculation used to analyze data points by creating a series of averages of different subsets of the full data set. The most common type of moving average is the simple moving average, which calculates the average of a set number of data points over a specified time period.
Types of Moving Averages
- Simple Moving Average (SMA)
- Exponential Moving Average (EMA)
- Weighted Moving Average (WMA)
Using Moving Averages for Trend Analysis
Identifying Trends
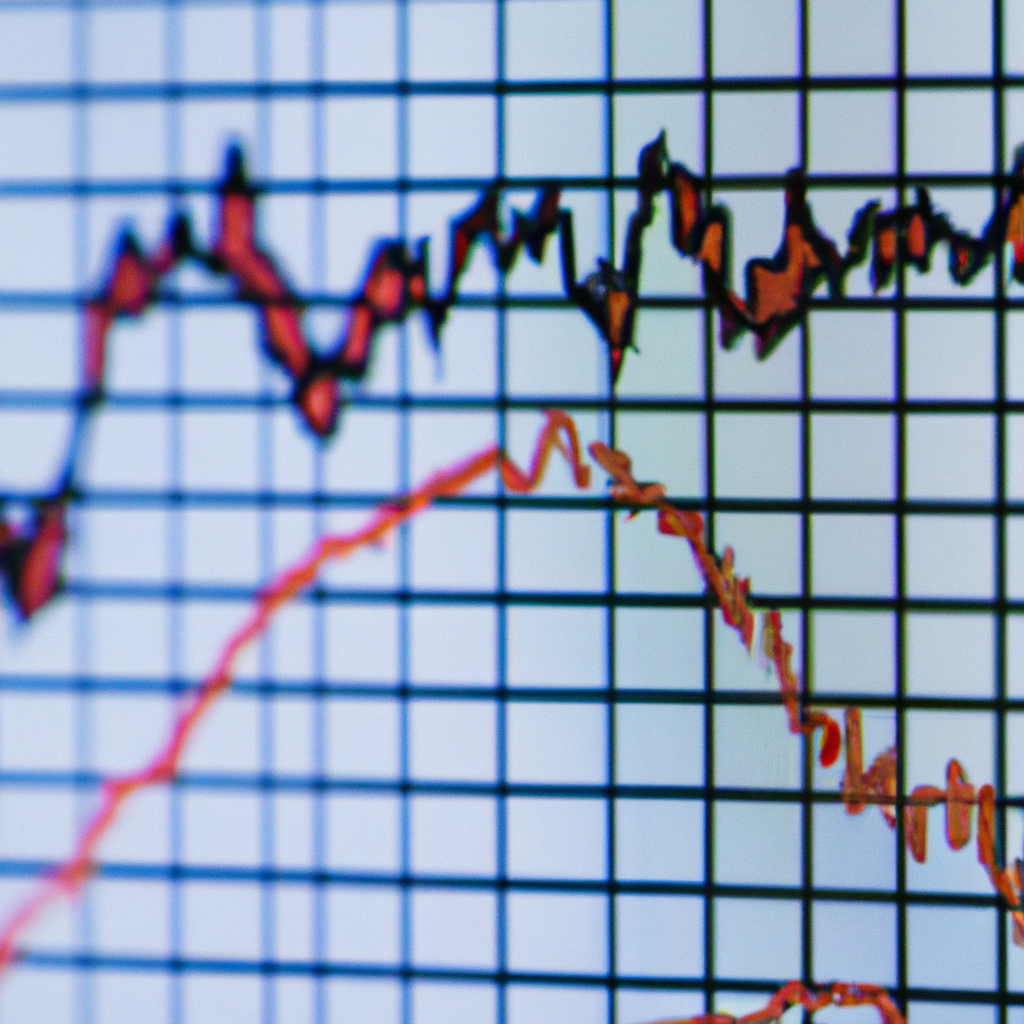
One of the primary uses of moving averages is to identify trends in data. By plotting a moving average line on a chart, you can see whether the data is trending upwards, downwards, or moving sideways. When the data points are above the moving average line, it indicates an uptrend, while data points below the line suggest a downtrend.
Signal for Buying or Selling
Another way to use moving averages is to generate buy or sell signals. When a short-term moving average crosses above a long-term moving average, it is considered a bullish signal to buy. Conversely, when the short-term moving average crosses below the long-term moving average, it is a bearish signal to sell.
Support and Resistance Levels
Moving averages can also act as support or resistance levels in a trend. When the price of an asset approaches a moving average, it may bounce off the line, indicating a level of support or resistance. Traders often use moving averages to set stop-loss orders or take-profit levels based on these support and resistance levels.
Conclusion
Using moving averages for trend analysis can help traders and analysts better understand the underlying patterns in data. Whether you are looking to identify trends, generate buy or sell signals, or set support and resistance levels, moving averages can be a valuable tool in your analysis toolkit.